AFL Home AFLM Team Ratings AFLM Match Predictions AFLM Ladder Simulations
Predicted ladder positions current as at Round -1 (run on 2026-04-07)
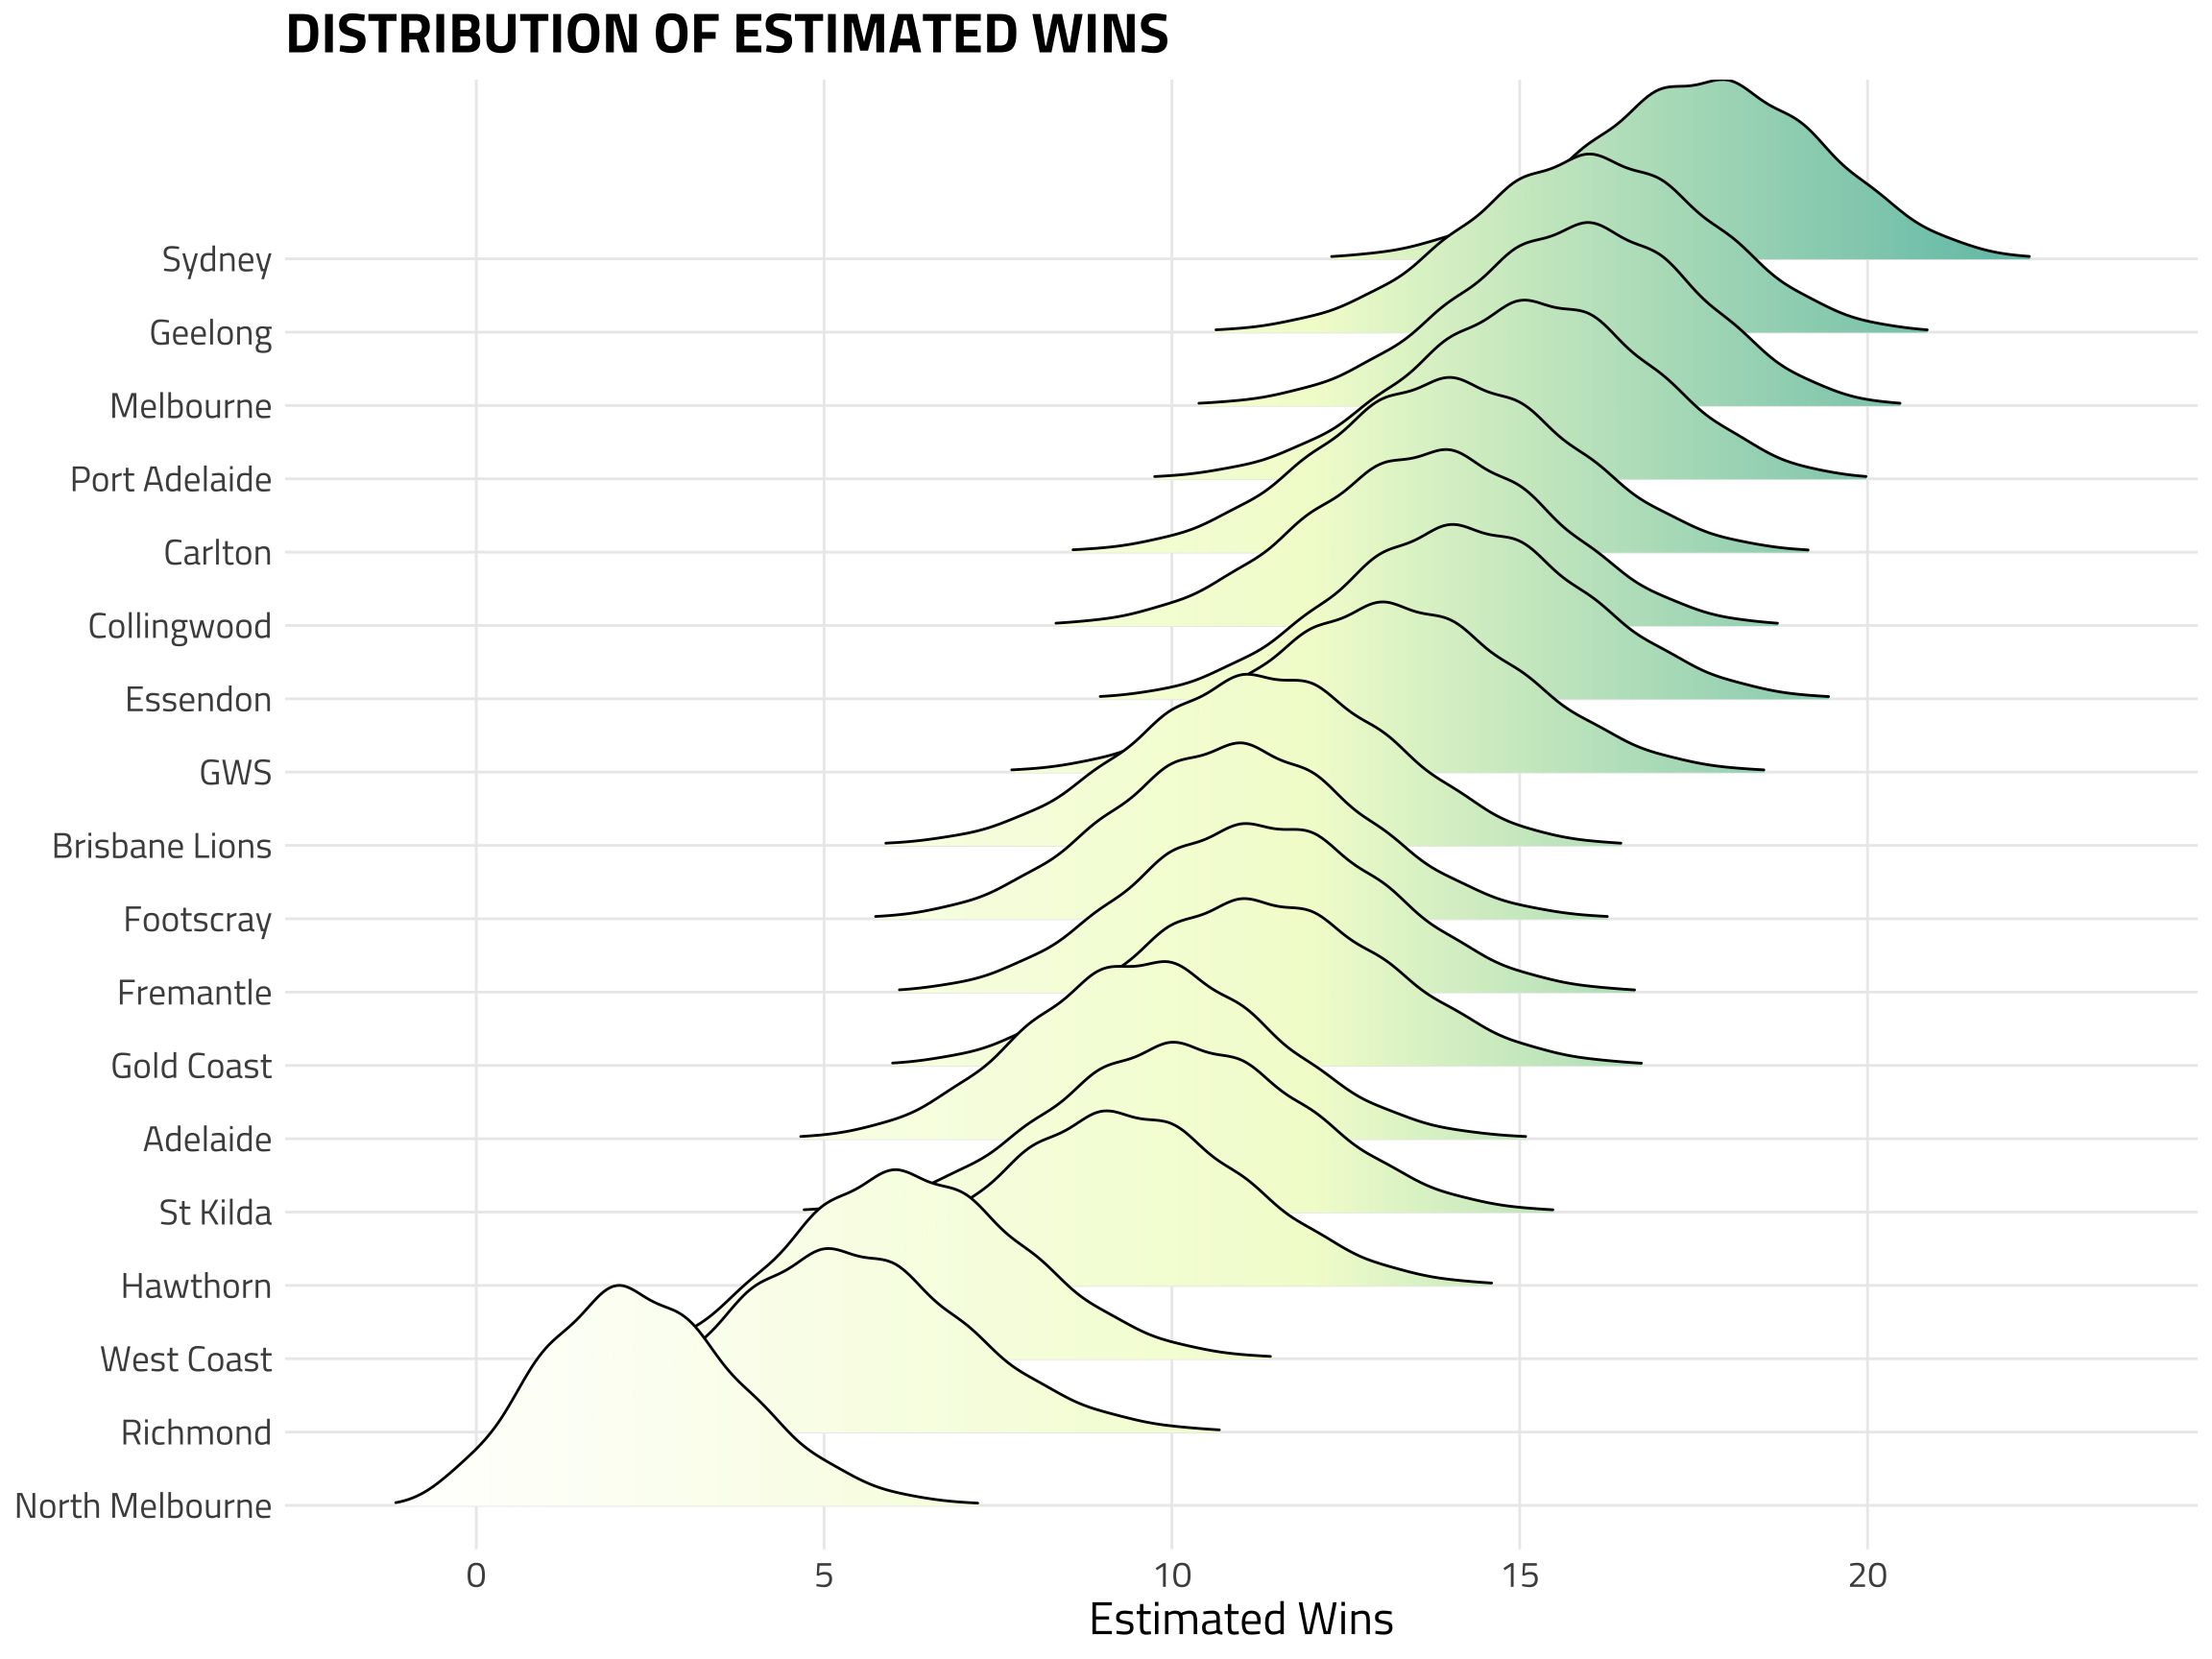
Based on 50,000 sims (run cold)